Return on investment is a key driving force in most cost-related decisions. It is especially important to ensure that the investment delivers the promised performance when the expenditure is a large energy efficiency project. A building’s energy efficiency performance is tracked through a process called Measurement and Verification (M&V). Through planning, data collection, and analysis, the M&V process creates a verifiable report of a building’s energy savings.
The preeminent M&V protocol used by new development and retrofit projects worldwide is the International Performance Measurement and Verification Protocol (IPMVP), which specifies four general approaches (A, B, C, and D) requiring energy, building, and/or operational data for determining energy savings. Option selection involves consideration of numerous aspects, including location of the Energy Efficiency Measure (EEM) measurement boundary and the availability and/or reliability of the measured or estimated data. For example, the Option C Whole Facility Measurement approach uses empirical modeling, such as multivariate regression analysis or similar methods, to analyze energy performance by accounting for facility-level changes in operations, occupancy, or other independent variables. These relationships between energy use and independent variables are needed to “normalize” energy use, with “normalization” generally interpreted as a statistically valid means of adjusting pre- and post-project energy use to a common set of conditions (i.e., weather or occupancy), so that savings can be properly estimated.
With an increased number of buildings equipped with smart meters, which provide hourly or sub-hourly interval data, and recent legislation having allowed more flexibility in M&V protocols, Normalized Metered Energy Consumption (NMEC), sometimes referred to as M&V 2.0, has become an indispensable tool to normalize energy usage, quantify energy savings, and do both in a transparent and timely manner.
Legislation Establishing NMEC as an Energy Efficiency Driver
Normalized Metered Energy Consumption (NMEC) emerged in California as a result of two bills (AB 802 and SB 350), that when combined, streamline the incentivization of energy efficiency by authorizing utility companies to deliver pay-for-performance efficiency programs through a data-driven NMEC approach.
AB 802: Clean Energy and Pollution Reduction Act of 2015
Governor Brown signed Energy Efficiency Assembly Bill 802 (Williams, AB 802) in October 2015. AB 802 bolsters California’s support for enhancing energy efficiency statewide by authorizing the California Energy Commission (CEC) to create a building energy-use benchmarking and disclosure program. In addition, AB 802 expands the CEC’s energy data collection authority to improve the development and evaluation of policy and programs and the state’s energy infrastructure planning efforts.
Further, AB 802 created the NMEC term when it stated that the CPUC shall “…authorize electrical corporations or gas corporations to provide financial incentives, rebates, technical assistance, and support to their customers to increase the energy efficiency of existing buildings based on all estimated energy savings and energy usage reductions, taking into consideration the overall reduction in normalized metered energy consumption as a measure of energy savings.”
SB 350: Clean Energy and Pollution Reduction Act of 2015
Governor Brown signed the California Clean Energy and Pollution Reduction Act of 2015 (De León. SB 350) in October 2015. SB 350 established clean energy, clean air, and greenhouse gas (GHG) reduction goals that require the state to double statewide energy efficiency savings in electricity and natural gas end uses by 2030. It increases the use of Renewables Portfolio Standard (RPS) eligible resources, including solar, wind, biomass, geothermal, and others. Large utilities are required to develop and submit integrated resource plans (IRPs) to help meet these goals and reduce greenhouse gas (GHG) emissions. The IRPs detail how utilities will meet their customers’ resource needs, reduce GHG emissions, and ramp up the use of clean energy resources.
SB 350 also stipulates that the energy efficiency savings and demand reductions reported to support achieved targets of performance-driven outcomes “… shall be measured, taking into consideration the overall reduction in normalized metered electricity and natural gas consumption where these measurement techniques are feasible and cost-effective.”
What is Normalized Metered Energy Consumption?
Overall, NMEC is a set of tools and standards that, when applied to interval data, provides quantifiable and statistically significant reporting of normalized energy usage and energy savings due to an intervention, such as an energy efficiency project. NMEC provides clarity of energy savings despite energy usage and utility bills being dependent on a number of variables.
The California Public Utilities Commission’s Rulebook for Programs and Projects Based on Normalized Metered Energy Consumption Version 2, released January 2020 (CPUC Rulebook) defines NMEC as:
“a method used to measure gross energy savings using metered energy consumption data to compare baseline and reporting period consumption under normal operating conditions. Normalization of energy consumption is achieved using adjustment models that account for routine events, and other adjustments to account for non-routine events so that consumption in baseline and reporting periods can be directly compared as if all relevant variables were the same in the two periods. Normalized baseline period and/or reporting period energy consumption are calculated using one or more adjustment models.”
In other words, NMEC eliminates variability in energy drivers (weather, occupancy, production, etc.), allowing for an apples-to-apples comparison of energy usage before and after an energy efficiency project. The following example provides an overview of the step-by-step NMEC procedure.
What Does NMEC Look Like?
A commercial office building plans to implement an LED lighting upgrade, replace an old chiller, and update the HVAC control system. Calculating savings for the individual measures using energy modeling or other methods can be time-consuming and complicated by the interactive effects between the measures. For example, the LED lighting upgrade will reduce the internal cooling load, thereby reducing the load on the chiller, which is to be upgraded. NMEC takes a whole-building approach to energy savings by measuring savings at the M&V boundary, thereby reducing potential issues with calculating interactive effects across measures.
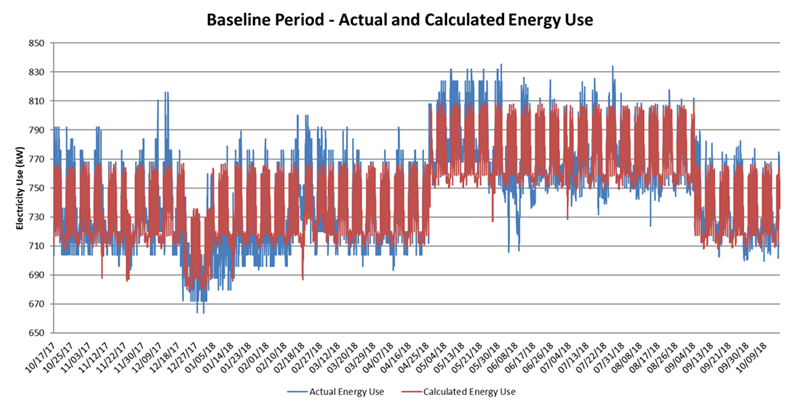
The office already had a smart electric meter installed, so they are able to pull 12-months of interval data prior to the implementation of the EEMs. This energy usage interval data is typically analyzed in hourly or 15-minute intervals. Corresponding outside air temperature and occupancy interval data is compiled for the same 12-months as the historical energy data, the baseline period. Next, a regression model is created to correlate the dependent variable, energy usage, to the independent variables, outside air temperature or degree days and occupancy. The linear regression techniques include reviewing residual plots, checking for outlier data, and testing different regression equation forms until minimum statistical thresholds are achieved. The review of all statistics is beyond the scope of this introduction, but some key model statistics include Fractional Savings Uncertainty (FSU), Coefficient of Determination (R2), Adjusted Coefficient of Determination (Adj. R2), Coefficient of Variance of the Root Mean Square Error (CV(RMSE)), Net Determination Bias (NDB), Normalized Mean Bias Error (NMBE), and independent variable P-values. The simple baseline regression equation may take the following form:
Baseline Energy UsageActual = A + B × Outside Air TemperatureActual + C × OccupancyActual
The final step in the normalization of the baseline period energy usage is to apply this regression equation to a dataset of normal or typical independent variables. Typical independent variables include California Climate Zone (CACZ) or Typical Meteorological Year (TMY) weather data which provides typical hourly interval weather data by location. A typical occupancy schedule should be developed to include typical holidays, typical after-hours events, and typical building occupancy schedules. Applying the baseline regression equation developed with the actual historical weather data and occupancy to the typical annual weather data and occupancy creates the normalized baseline energy usage dataset.
Baseline Energy UsageNormalized = A + B × Outside Air TemperatureTypical + C × OccupancyTypical
After the energy efficiency project completion, the same steps are taken to create the normalized reporting period energy usage dataset. Actual raw data is collected from the interval electric meter and corresponding actual occupancy and actual weather data after the EEMs are fully implemented. A minimum of twelve months of post-implementation is preferred, but three or six months of data can suffice in some cases. This raw data is used to develop the reporting period regression equation of the same form as the baseline regression equation. Finally, the same normalized independent variable datasets, typical annual weather and occupancy, are applied to the reporting period regression equation to output the normalized reporting period energy usage dataset.
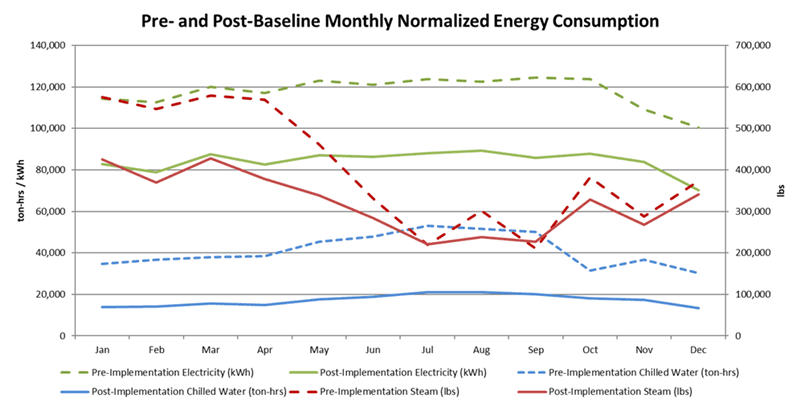
Now with both the baseline (pre-implementation) and reporting period (post-implementation) annual energy usages normalized, an apples-to-apples comparison can be done to calculate the normalized energy savings of the project. This normalized annual energy savings is independent of fluctuations in occupancy or weather that may have occurred during the post-implementation phase. So, say occupancy reduced 25% due to COVID-19, but the summer was also abnormally warm—the normalized energy usage datasets remove these variabilities and provide clarity of the energy performance of the building during a typical year.
Energy Savings UsageNormalized = Baseline UsageNormalized – Reporting Period UsageNormalized
Be sure to learn about the Advantages of NMEC and contact Veregy to determine what kind of measurement and verification is right for you.


