Have you ever woken in the middle of the night in a cold sweat wondering if your plant is using more energy than it should, putting you at a disadvantage as compared to your competition? Even if your energy monitoring or energy management system is in place you may not have the required insight to improve your performance and keep you competitive.
But lost sleep isn’t necessary. Simple but effective integration of readily available data in the plant can provide a whole new level of actionable information. Here’s what you need to know.
Take Control of Energy Efficiency
To get needed insight you would need to have the ability to record or log data across multiple systems, including production data. As the old adage goes, you can’t manage what you don’t measure. It follows that if you are able to measure something with a greater level of precision and correlate it to the bottom line with production data, you will be able to manage it even better. Overall Equipment Effectiveness (OEE) measures the percentage of manufacturing time that is truly productive.
The same should be measured as it relates to energy so that the overall energy used to make each widget is as low as it can be. Most will already be familiar with the concept of Key Performance Indicators (KPIs) and how they can inform system optimization. By adding the factor of production data and establishing energy intensity KPIs, you can take your energy optimization to the next level, stay on top of costly or dangerous miscalibrations, and truly take control of your energy efficiency.
Monitoring energy usage of systems such as cooling towers can take energy optimization to the next level
What KPIs Should be Tracked?
KPIs are important tools for optimizing any system, and chillers and cooling system are no exception.
We recommend placing sensors at key points in a chiller system for monitoring energy usage in kW including the cooler tower pump, chiller, cooling tower fan, and the AHU fan, as well as water return temperatures, chilled water supply temperature, and chilled water flow.
To take a more precise look at your system and add value to your KPIs, adding monitoring for chilled water supply temperature, chilled water flow and chilled water return temperature may be of much greater value than monitoring the kW of the chiller itself. Location matters as well. Many times, plants make the mistake of installing power meters on panels around the plant but if the area covers more than one production line or department, the value of this measurement is limited. Tracking should be system-based and not area-based.
Include KPI Production Data
Any system within your plant consuming energy has crucial indicators that should be monitored to ensure efficiency, reliability, and maintainability. You can aggregate the various energy usage KPIs of a given system to realize a system-wide KPI, or taken a step further aggregate each essential system KPI to give you a reading on overall plant energy performance. These system or plant energy performance KPIs are the best indicators of overall energy use and should be carefully monitored across the board to ensure efficiency.
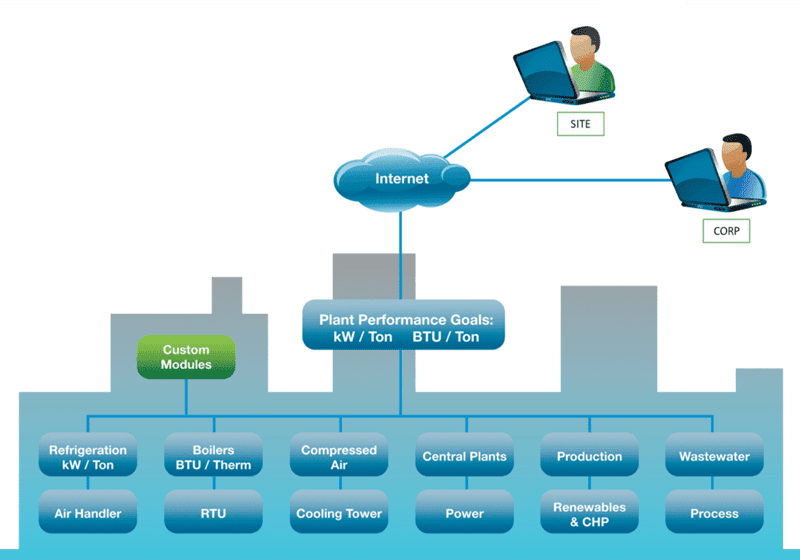
A fully developed system should include KPIs for individual systems as well as the plant. Each energy or water system in the plant has its own KPI, including kW/ton of refrigeration for the ammonia plant and cfm per kW for compressed air, and so on, with more granular KPIs for components of each system as shown in Figure 1.
Figure 1: Depicted is the basic KPI architecture for a fully developed system
For the plant as a whole, the total energy per unit of production would be an overall metric to track. The energy usage per unit of product, say kWh per gallon of ice cream, provides an overall perspective of the plant energy use at all levels of production. By putting targets to each of the systems and for the plant as a whole you can see the interactive effects of energy reductions for a plant and the impact on the total energy per unit of product.
For example, by shutting off the 400 Watt Metal Halide lights in the storage at night you may be forced to increase the amount of heating in the space as well. By installing Variable Frequency Drives (VFDs) on motors in a conditioned Motor Control Center room you may increase the amount of cooling required while saving energy with the VFDs.
Including production data can be done in a number of ways, either queried from an SQL database or directly taken from a PLC on the production line. This data should be correlated with the actual reported production values and can then be combined with your KPI data to generate energy intensity KPIs, such as kWh per pound of product. Once you are able to establish these energy intensity KPIs, you can use them in a variety of ways to improve your process and save money and time.
Leveraging KPIs for Effective Decision-Making
Employing energy intensity KPIs based on energy monitoring for various systems will help simplify tracking and reporting and enable informed and effective energy decisions.
Once you are tracking KPIs, you will be able to see how much energy each component of each system is using, but the real value comes when you begin to correlate these energy KPIs with production data, creating an energy intensity KPI and the ability to view it in real-time.
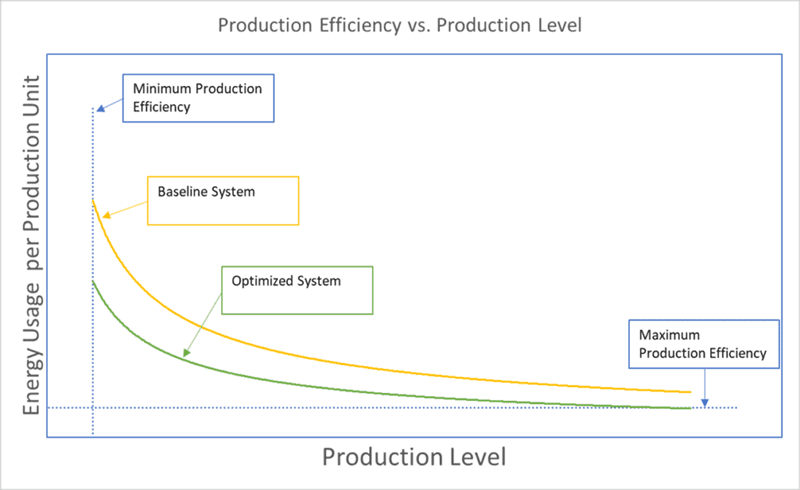
This data point is effectively how much energy you use as it relates to your end product which is not equal at all levels of production. Figure 2 shows the impact of production levels have on energy usage.
Figure 2: Production Level Energy Intensity
A low production level requires much more energy by unit of production since many times there is an inherit energy use to simply run the plant and energy systems are usually less efficient at part load. Production data is essential to monitoring and optimizing your system since it is your best measure of the real and scalable output of your plant.
Tracking your system operations over time with this data is the tool you need to optimize systems to hit target energy goals and verify the energy savings from implemented efficiency measures. As discussed previously, there are two main areas of focus, first optimizing each system within the plant, and second optimizing the overall energy per unit of product.
Additionally, this data can allow you to compare performance of similar systems, proactively address slipping efficiencies, compare shift operations to one another, and identify equipment left operating when not needed. Production KPIs can be used to establish a baseline for a system operation to be compared with an optimized system, or against several optimization possibilities.
Energy use is probably one of the biggest costs in your plant and understanding why charges are fluctuating is the key to controlling the cost. You can use energy KPIs to actively manage and forecast your plant energy budget and stay on top of your utility bills by checking their accuracy against your own numbers.
Using System Software for Reports and Alerts
It’s beneficial to occasionally take a step back and evaluate your energy usage at multiple levels, establish reachable goals, and optimize your plant at every level. However, we all know there are only so many hours in the day, and oftentimes the big picture can be put on the back burner in favor of more pressing issues. A great way to stay on top of your KPIs is to use your system software to set up regular reports and customized alerts.
An alert is a notification of a preset condition, i.e., “at 09:47:35, peak demand for month transitioned to active.” By setting alerts for important conditions, you can rest easy knowing they will not go undetected. When you see your utility billing rate for peak demand, you will be glad you set an alert. Example of alerts include:
- Peak demand alerting: Set targets for plant peak at kW and get alerts when actual demand is approaching target value to take action.
- Energy budget alerting: Set weekly or monthly energy usage targets and get alerts when actual usage is approaching target value.
- Operating below target efficiency: Set targets for system or equipment efficiency and get alerts if efficiency is continuously below target for the set number of hours.
- Sensor/meter reading out of range: Have system operators provide input on the normal range of values for key operational parameters like power, pressures, temperatures, and flow rates and get an alert if a sensor is continuously out of range for a set amount of time.
Alerts should be meaningful and actionable to avoid becoming noise. They can be used at the plant, system, and equipment level, and can also help ensure the safety of your plant workers in many cases.
By sending alerts, plant operators will learn how actions they may be taking impact the cost and energy use of the plant. For example, what is the real impact of having another air compressor operating at part load just in case? What is the impact of starting another chiller when your shift starts just because that’s the way it was always done? Learning through alerts and energy faults can be an easy and inexpensive way to optimize the plant.
Finding Patterns of Energy Use
Once your energy intensity KPIs are in place for each system and on the plant level, you can keep an eye on potential problems with alerts, while focusing on high-level monitoring using reports. Tracking a snapshot keeps you out of the red, but examining a longer-term description of the energy use throughout your plant is how to find the more difficult energy inefficiencies.
Take for example your cooling system running at normal levels, but on a weekend, when no production is taking place, it runs because you need some cooling for the security office. You can find such instances in weekly or monthly reports and begin trimming subtle, but wasteful inefficiencies.
Another integral aspect of having complete oversight of your energy usage is your ability to ensure the quality of your data and the integrity of your various meters and sensors. In the installation phase, it’s essential to ensure instrumentation is scaled properly, that calculated values are accurate, and assumptions are known at startup. If this is done properly the deployment of alerts to detect anomalies such as flat-lined data, fixed value, or out-of-range data can help find faulty sensors immediately.
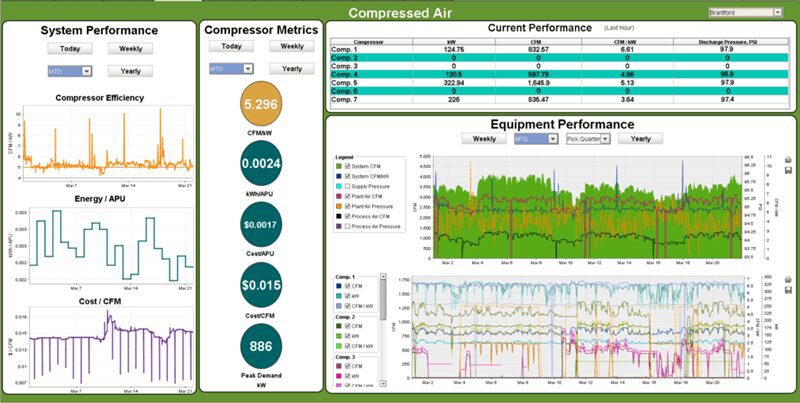
Enpowered’s software provides visibility into the most important KPIs of a compressed air system.
As you monitor for unexpected values based on KPIs and other related data, you can calibrate or replace sensors as needed, and integrate new equipment and instrumentation. By making sure your instruments are accurate from the start and setting alerts, you can be on top of any metering issues before they become costly or dangerous. As you monitor for unexpected values based on KPIs and other related data, you can calibrate or replace sensors as needed, and integrate new equipment and instrumentation. By making sure your instruments are accurate from the start and setting alerts, you can be on top of any metering issues before they become costly or dangerous.
Taking Action and Making a Difference
The reality of integrating energy KPIs and production data into your system and monitoring routine is that it will make your life easier. Having actionable information in real time as it relates to energy is the best way to not only optimizing your energy efficiency, but also maintaining control of your systems and preventing wasteful and costly mistakes and malfunctions.
As you crawl into bed each night, you won’t be worrying about energy budget overruns or peak demand rates. You can relax knowing that the KPIs and your energy monitoring system have got your back.
About Veregy
Veregy is a leading energy, engineering, commissioning, and controls company that provides customer-focused consulting services to commercial, industrial, institutional and utilities across the United States and Canada. Enpowered Solutions is a single-source provider of energy and engineering consulting services aimed at improving energy efficiency, enhancing control of energy assets within buildings and manufacturing, and ensuring system operations are optimized through retro and new building commissioning.


